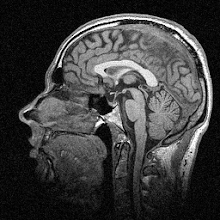
While I don’t usually post about clinical work, sometimes a paper just leaps out at me and makes me go, “hmm, that’s interesting!” So it was with this study, which explores the medium-term effects (over five years) of chronic deep-brain stimulation in Parkinson’s disease (PD). I’m by no means a clinician or an expert on PD so I’m very keen to make sure the information in here is correct. Please leave me useful comments if it isn’t!
Parkinson’s disease is a neurodegenerative disease affecting the motor system. It’s characterised by several symptoms, with the one most people connect to Parkinson’s being a persistent awake resting tremor that disappears with voluntary movement and sleep. Other symptoms include increased rigidity, slow movements (bradykinesia) and postural instability. There are also often substantial cognitive impairments as the disease progresses. The symptoms appear to be caused by the death of cells in the basal ganglia that produce the neurotransmitter dopamine. The reason for this cell death is still not understood.
Treatment is available for Parkinson’s, most commonly in the form of L-DOPA, a drug that at first replenishes the amount of dopamine in the system and thus relieves symptoms somewhat. It does have side-effects and becomes less effective over time however, and other drugs are also used to control the symptoms. Relatively recently, deep brain stimulation (DBS) has come to the fore as an effective treatment, especially when drugs aren’t working. The idea is that an electrode is inserted deep into the brain and areas of the basal ganglia are stimulated with electrical impulses to regulate their output, reducing the symptoms.
Because DBS is still quite new, we don’t really know what its long-term effects are. Short-term the effects are spectacular; see this video of a patient with and without his DBS system switched on. It’s quite dramatic (he turns it off at about 1:25):
But what about in the medium to long term? In the paper I discuss today, the researchers followed up eight patients after five years of DBS to see whether there was any effect on either their clinical symptoms or measures of motor performance. Over these five years the patients received continuous DBS and also a drug regimen, adjusted to control their symptoms as required. Symptoms were measured using the Unified Parkinson’s Disease Rating Scale (UPDRS) and the motor kinematics measured were ankle movement speed and strength. Prior to testing, patients stopped taking drugs and turned off their stimulators for 12 hours overnight.
The experimenters tested the patients both with DBS turned on and off at the start of the experiment (year 0) and again five years later (year 5). Their main findings were that, as expected, DBS reduced symptoms and improved movement speed and strength overall – both at year 0 and year 5. When comparing the two time periods however, they found an interesting result. UPDRS scores increased over five years, i.e. symptoms got worse, but the speed and strength of the ankle movement actually improved. So it looks like DBS gave no long-term improvement on the UPDRS scores but did produce an improvement in mobility and strength.
How can this apparent contradiction be explained? Well, first it’s quite difficult to say what would have happened without DBS over five years, as there was no adequate control group in this study. As Parkinsonism is a degenerative disease, the UPDRS scores would most certainly have got worse over five years anyway. But being able to say for sure whether the DBS reduced this worsening of symptoms is very hard to say. The researchers have a go at saying why this measure didn’t improve versus the other motor measures improving though: the UPDRS measurement involves repetitive movements like finger tapping, which the basal ganglia are heavily involved in; whereas the ankle movements tested for strength and speed are discrete movements that don’t really need coordinated muscle output over time – so they aren’t as regulated by the basal ganglia and therefore aren’t as affected by Parkinson’s.
There’s also the possibility that DBS increases dopamine production (aside from just regulating the output of the basal ganglia) and that this actually increases motivation and “energise” action, which is known to improve muscle strength. Also, if DBS improves quality of life and makes patients more active, their muscle strength and speed will change purely as a result of using their muscles more.
So there’s quite a lot here for a relatively short paper. The most interesting point from a basic science perspective I think is the contention that the basal ganglia don’t really have much to do with large discrete movements, which is why the symptom scores get worse (as they’re based on repetitive movements). It’s certainly plausible, though I’d be wary of reading too much into it.
From a clinical point of view though I guess the most interesting finding is that sustained DBS does improve motor outcomes over the medium term. But a weakness of this work is that without, as I say, an adequate non-stimulated control group, it’s very difficult to say whether it has any effect on the UPDRS scores differential to if the patients were not stimulated. Of course, there are ethical issues with not giving people the best treatment currently available just so you can test how they compare to people who are.
---
Sturman MM, Vaillancourt DE, Verhagen Metman L, Bakay RA, & Corcos DM (2010). Effects of five years of chronic STN stimulation on muscle strength and movement speed. Experimental Brain Research, 205 (4), 435-43 PMID: 20697699
Monday, 30 August 2010
Friday, 27 August 2010
Walking sub-optimally is the way forward
Today we’re going to do something a little different. I’ve been posting a lot about reaching movements, because that’s what I’m most interested in, but it may surprise you to learn that humans do actually have the capacity to move other parts of their bodies as well. I know, I’m as shocked as you are… so! The paper I’m going to cover is about the regulation of step variability in walking. It’s a little longer and more complex than normal, so strap yourselves in.
Walking is a hard problem, and we’re not really sure how we do it. Like reaching, there are many muscles to coordinate in order to make a step forward. Unlike in arm reaching, these coordinated steps need to follow one another cyclically in such a way as to keep the body stable and upright while simultaneously moving it over terrain that might well be rough and uneven. Just think for a moment about how difficult that is, and what different processes might be involved in the control of such movements.
One question that remains unanswered is how we control variability in walking. It’s a simple matter to control average position or velocity, but the variation in these parameters between steps is still unexplained. It is pretty well established that over the long-term people tend to try to minimize energy costs while walking – hence the gait we learn to adopt over the first few years of life. But there’s evidence that such a seemingly “optimal” strategy is not the whole story.
Consider walking on a treadmill. What’s the primary goal of continuous treadmill walking? Well, it’s to not fall off. The researchers in the article took that idea and reasoned that because the treadmill is moving at a constant speed, the best way not to fall off is to move at a constant speed yourself. That’s not the only strategy of course – you could also do something a little more complicated like make some short, quick steps followed by some long, slow ones in sequence, which would also keep you on the treadmill.
To test how the parameters varied, the researchers used five different walking speeds. You can see this in the figure below (Figure 3 in the paper):
L is stride length, T is stride time and S is stride speed. So A-C in the figure show how these values change with the five different treadmill speeds – length increases, time decreases and speed increases. D-F show the variability (σ) in these different parameters. G-I show something slightly more complex: a value called α that is defined as a measure of persistence, i.e. how much or little the parameters were corrected on subsequent strides. Values of α > ½ mean that there was less correction, whereas values < ½ mean that there was more correction. So panels G-I show that variability in stride length and time were not generally corrected quickly, but that variations in stride speed were.
Read that last paragraph through again to make sure you get it. It will be important shortly!
So: now we have a measure of human walking parameters. The question is, how are these parameters produced by the motor control system? That is, what does the system care about when it initiates and monitors walking? Well, one thing we can get from the data here is that the system seems to care about stride speed, but doesn’t care about stride time and stride length individually. And if that’s the case, then as long as the coupled length and time lie on a line that defines the speed, the system should be happy. A line a bit like this (figure 2B in the paper):
The figure shows the GEM (which stands for Goal Equivalent Manifold, essentially the line of constant speed) plotted against stride time and stride length. The red dots show some data. Right away you can see that the dots generally lie along the line. Ignore the green arrows, but do take note of the blue ones – they’re showing a measure of deviations tangent to (δT) and perpendicular to (δP) the line. Why is δT so much bigger than δP? Because perpendicular variations push you off the line and thus interfere with the goal, whereas tangential variations don’t. So the system is either not stepping off the line much in the first place or correcting heavily when it does.
Here’s one more figure (Figure 5C and D in the paper) showing the variability (σ) and persistence (α) for δT and δP :
You can see that δT is much more variable than δP, as you might expect from the shape of the data shown in the second figure. You can also see something else, however: the persistence for δP is less than ½, whereas the persistence for δT is greater than ½. Thus, the system cares very much about correcting not just stride speed but the combination of stride time and stride length that take the stride speed away from the goal speed.
Great, you may think, a lot of funny numbers to tell us that the system cares about maintaining a constant speed when it’s trying to maintain a constant speed! What do you scientists get paid for anyway? The cool thing about this paper is that the researchers are trying to figure out precisely how the brain produces these numbers. It turns out that if you just use an ‘optimal’ model that corrects for δP while ignoring δT, you don’t get the same numbers. So that can’t be it. How about if you specify in your model that you have to keep at a certain speed – say the same average speed as in the human data? That doesn’t work either. The numbers are better, but they’re not right.
The solution that seems to work best is when the deviations off the GEM line (i.e. δP) are overcorrected for. This controller is sub-optimal, so basically efficiency is being sacrificed for tight control over this parameter. Thus, humans don’t appear to simply minimize energy loss – they also perform more complex corrections depending on the task goal.
I’ve covered in a previous post the inkling that this might be the case; while we do tend to minimize energy over the long term, in the short term the optimization process is much more centred around the particular goal, and people are very good at exploiting the inherent variability in the motor system to perform the task more easily. This paper does a great job of testing these hypotheses and providing models to explain how this might happen. What I’d be interested to see in the future is an explanation of why the system is set up to overcorrect like that in the first place – is it overall a more efficient way of producing movement than just a standard optimization over all parameters? Time, perhaps, will tell.
--
Dingwell JB, John J, & Cusumano JP (2010). Do humans optimally exploit redundancy to control step variability in walking? PLoS computational biology, 6 (7) PMID: 20657664
Images copyright © 2010 Dingwell, John & Cusumano
Walking is a hard problem, and we’re not really sure how we do it. Like reaching, there are many muscles to coordinate in order to make a step forward. Unlike in arm reaching, these coordinated steps need to follow one another cyclically in such a way as to keep the body stable and upright while simultaneously moving it over terrain that might well be rough and uneven. Just think for a moment about how difficult that is, and what different processes might be involved in the control of such movements.
One question that remains unanswered is how we control variability in walking. It’s a simple matter to control average position or velocity, but the variation in these parameters between steps is still unexplained. It is pretty well established that over the long-term people tend to try to minimize energy costs while walking – hence the gait we learn to adopt over the first few years of life. But there’s evidence that such a seemingly “optimal” strategy is not the whole story.
Consider walking on a treadmill. What’s the primary goal of continuous treadmill walking? Well, it’s to not fall off. The researchers in the article took that idea and reasoned that because the treadmill is moving at a constant speed, the best way not to fall off is to move at a constant speed yourself. That’s not the only strategy of course – you could also do something a little more complicated like make some short, quick steps followed by some long, slow ones in sequence, which would also keep you on the treadmill.
To test how the parameters varied, the researchers used five different walking speeds. You can see this in the figure below (Figure 3 in the paper):
Human treadmill walking data with speed as percentage of preferred walking speed (PWS)
L is stride length, T is stride time and S is stride speed. So A-C in the figure show how these values change with the five different treadmill speeds – length increases, time decreases and speed increases. D-F show the variability (σ) in these different parameters. G-I show something slightly more complex: a value called α that is defined as a measure of persistence, i.e. how much or little the parameters were corrected on subsequent strides. Values of α > ½ mean that there was less correction, whereas values < ½ mean that there was more correction. So panels G-I show that variability in stride length and time were not generally corrected quickly, but that variations in stride speed were.
Read that last paragraph through again to make sure you get it. It will be important shortly!
So: now we have a measure of human walking parameters. The question is, how are these parameters produced by the motor control system? That is, what does the system care about when it initiates and monitors walking? Well, one thing we can get from the data here is that the system seems to care about stride speed, but doesn’t care about stride time and stride length individually. And if that’s the case, then as long as the coupled length and time lie on a line that defines the speed, the system should be happy. A line a bit like this (figure 2B in the paper):
Human stride parameters lie along line of constant speed
The figure shows the GEM (which stands for Goal Equivalent Manifold, essentially the line of constant speed) plotted against stride time and stride length. The red dots show some data. Right away you can see that the dots generally lie along the line. Ignore the green arrows, but do take note of the blue ones – they’re showing a measure of deviations tangent to (δT) and perpendicular to (δP) the line. Why is δT so much bigger than δP? Because perpendicular variations push you off the line and thus interfere with the goal, whereas tangential variations don’t. So the system is either not stepping off the line much in the first place or correcting heavily when it does.
Here’s one more figure (Figure 5C and D in the paper) showing the variability (σ) and persistence (α) for δT and δP :
Variability and persistence of deviations
You can see that δT is much more variable than δP, as you might expect from the shape of the data shown in the second figure. You can also see something else, however: the persistence for δP is less than ½, whereas the persistence for δT is greater than ½. Thus, the system cares very much about correcting not just stride speed but the combination of stride time and stride length that take the stride speed away from the goal speed.
Great, you may think, a lot of funny numbers to tell us that the system cares about maintaining a constant speed when it’s trying to maintain a constant speed! What do you scientists get paid for anyway? The cool thing about this paper is that the researchers are trying to figure out precisely how the brain produces these numbers. It turns out that if you just use an ‘optimal’ model that corrects for δP while ignoring δT, you don’t get the same numbers. So that can’t be it. How about if you specify in your model that you have to keep at a certain speed – say the same average speed as in the human data? That doesn’t work either. The numbers are better, but they’re not right.
The solution that seems to work best is when the deviations off the GEM line (i.e. δP) are overcorrected for. This controller is sub-optimal, so basically efficiency is being sacrificed for tight control over this parameter. Thus, humans don’t appear to simply minimize energy loss – they also perform more complex corrections depending on the task goal.
I’ve covered in a previous post the inkling that this might be the case; while we do tend to minimize energy over the long term, in the short term the optimization process is much more centred around the particular goal, and people are very good at exploiting the inherent variability in the motor system to perform the task more easily. This paper does a great job of testing these hypotheses and providing models to explain how this might happen. What I’d be interested to see in the future is an explanation of why the system is set up to overcorrect like that in the first place – is it overall a more efficient way of producing movement than just a standard optimization over all parameters? Time, perhaps, will tell.
--
Dingwell JB, John J, & Cusumano JP (2010). Do humans optimally exploit redundancy to control step variability in walking? PLoS computational biology, 6 (7) PMID: 20657664
Images copyright © 2010 Dingwell, John & Cusumano
Monday, 23 August 2010
Learning without thinking
Scratching around on the internet this afternoon on my first day back from holiday, I was kind of reluctant to dive straight back into taking papers apart. After all, I have spent the majority of the last three weeks drinking beer and eating pies in the UK, and the increase in my waistline has most likely been mirrored by the decrease in my critical faculties (as happens when you spend time away from the cutting edge). However, I ran across a really cool little article that reminded me just why I enjoy all this motor control stuff. So here goes nothing!
There’s been some work in recent years on the differences between implicit and explicit motor learning – that is, the kind of learning the brain does by itself, relying on cues from the environment, vs. using a well-defined strategy to perform a task. For example, learning to carry a full glass of water without spilling by just doing it and getting it wrong a lot until you implicitly work out how, or by explicitly telling yourself, “Ok, I’m going to try to keep the water as level as possible.” A fun little study on this was performed by Mazzoni and Krakauer (2006) in which they showed that giving their participants an explicit strategy in a visuomotor rotation task (reaching to a target where the reach is rotated) actually hurt their performance. Essentially they started off being able to perform the task well using the explicit strategy, which was something like ‘aim for the target to the left of the one you need to hit’. However as the task went on the implicit system doggedly learned it – and conflicted with the explicit strategy – so that the participants were making more errors at the end than at the beginning.
The paper I’m looking at today follows up on this result. Implicit error-based learning is thought to be the province of the cerebellum, the primitive, walnut-shaped bit at the back of the brain. The researchers hit upon the idea that if the cerebellum is important for implicit learning, then perhaps patients with cerebellar impairments would actually find it easier to perform the task relative to healthy control participants. To test this, they told both sets of participants to use an explicit strategy in a visuomotor rotation task, just like in the previous study, and measured their ‘drift’ from the ideal reaching movement.
Below you can see the results (Figure 2A in the paper):
Open circles are all control participants, whereas filled circles are all patients. The black circles at the start show baseline performance – both groups performed pretty well and similarly. Red circles show the first couple of movements after the rotation was applied, and before participants were told to use the strategy. You can see that the participants are reaching completely the wrong way. The blue section shows reaching while using the strategy. Here’s the nice bit: the cerebellar patients are doing better than the controls, as their error is closer to zero, whereas the controls are steadily drifting away from the intended target. Magenta shows when the participants are asked to stop using the strategy and the final cyan markers show the ‘washout’ phase as both groups get back to baseline without an imposed rotation – though the patients manage much more quickly than the controls.
So it looks very much like the cerebellar patients, because their cerebellums are impaired at implicit learning, are able to perform this task better than healthy people. What’s kind of interesting is that other research has shown that cerebellar patients aren’t very good at forming explicit strategies on their own, which is something that healthy people do without even thinking about it. The tentative conclusion of the researchers is that it’s not so much that the implicit and explicit systems are completely separate, but that the implicit system can inform the development of explicit strategies – which is impaired if the cerebellum isn’t working properly.
I didn’t like everything in this paper. I was particularly frustrated with the method section, which talks about the kind of screen they used. I wasn’t sure whether the images shown to participants were on a screen in front of them or whether the screen was placed over the workspace in a virtual-reality setup; it was unclear. There was also a sentence claiming that the cerebellar patients’ performance was ‘less’ than the controls, when in fact it was better. Other than these minor niggles though, it’s a really nice paper showing a very cool effect.
--
Taylor JA, Klemfuss NM, & Ivry RB (2010). An Explicit Strategy Prevails When the Cerebellum Fails to Compute Movement Errors Cerebellum PMID: 20697860
Images copyright © 2010 Taylor, Klemfuss & Ivry
There’s been some work in recent years on the differences between implicit and explicit motor learning – that is, the kind of learning the brain does by itself, relying on cues from the environment, vs. using a well-defined strategy to perform a task. For example, learning to carry a full glass of water without spilling by just doing it and getting it wrong a lot until you implicitly work out how, or by explicitly telling yourself, “Ok, I’m going to try to keep the water as level as possible.” A fun little study on this was performed by Mazzoni and Krakauer (2006) in which they showed that giving their participants an explicit strategy in a visuomotor rotation task (reaching to a target where the reach is rotated) actually hurt their performance. Essentially they started off being able to perform the task well using the explicit strategy, which was something like ‘aim for the target to the left of the one you need to hit’. However as the task went on the implicit system doggedly learned it – and conflicted with the explicit strategy – so that the participants were making more errors at the end than at the beginning.
The paper I’m looking at today follows up on this result. Implicit error-based learning is thought to be the province of the cerebellum, the primitive, walnut-shaped bit at the back of the brain. The researchers hit upon the idea that if the cerebellum is important for implicit learning, then perhaps patients with cerebellar impairments would actually find it easier to perform the task relative to healthy control participants. To test this, they told both sets of participants to use an explicit strategy in a visuomotor rotation task, just like in the previous study, and measured their ‘drift’ from the ideal reaching movement.
Below you can see the results (Figure 2A in the paper):
Target error across movements
Open circles are all control participants, whereas filled circles are all patients. The black circles at the start show baseline performance – both groups performed pretty well and similarly. Red circles show the first couple of movements after the rotation was applied, and before participants were told to use the strategy. You can see that the participants are reaching completely the wrong way. The blue section shows reaching while using the strategy. Here’s the nice bit: the cerebellar patients are doing better than the controls, as their error is closer to zero, whereas the controls are steadily drifting away from the intended target. Magenta shows when the participants are asked to stop using the strategy and the final cyan markers show the ‘washout’ phase as both groups get back to baseline without an imposed rotation – though the patients manage much more quickly than the controls.
So it looks very much like the cerebellar patients, because their cerebellums are impaired at implicit learning, are able to perform this task better than healthy people. What’s kind of interesting is that other research has shown that cerebellar patients aren’t very good at forming explicit strategies on their own, which is something that healthy people do without even thinking about it. The tentative conclusion of the researchers is that it’s not so much that the implicit and explicit systems are completely separate, but that the implicit system can inform the development of explicit strategies – which is impaired if the cerebellum isn’t working properly.
I didn’t like everything in this paper. I was particularly frustrated with the method section, which talks about the kind of screen they used. I wasn’t sure whether the images shown to participants were on a screen in front of them or whether the screen was placed over the workspace in a virtual-reality setup; it was unclear. There was also a sentence claiming that the cerebellar patients’ performance was ‘less’ than the controls, when in fact it was better. Other than these minor niggles though, it’s a really nice paper showing a very cool effect.
--
Taylor JA, Klemfuss NM, & Ivry RB (2010). An Explicit Strategy Prevails When the Cerebellum Fails to Compute Movement Errors Cerebellum PMID: 20697860
Images copyright © 2010 Taylor, Klemfuss & Ivry
Labels:
adaptation,
behavioural,
cerebellum,
human,
motor,
patient
Wednesday, 4 August 2010
Hiatus
I'm about to head to the UK for a couple of weeks to visit the Edinburgh Festival, attend (and sing at!) a wedding, and see my friends and family. So the blog will be on hiatus for a little while. I might try to get a couple of papers read while I'm away, but don't count on it.
I'll be back the weekend of August 21st - expect to see more motor control discussion around then.
Subscribe to:
Posts (Atom)